Shift between Vexc and Bmax is caused by frequency changes.
In brief:
- Frequency change between the ground and excited states causes the shift between the vertical excitation and the band maximum.
- The mean value of the shift in a benchmark of 60 transitions in 28 molecules is 0.11 eV.
- We recommend always adopting the shift when comparing vertical excitations to band maxima.
It’s well known that the photoabsorption spectrum of molecules usually shows that the band maximum (Bmax) is redshifted in comparison to the vertical excitation (Vexc). Nevertheless, to the best of our knowledge, the origin of this redshift (we call it δ shift) has never been clarified.
We conducted a throughout analysis of the δ shift based on low-dimensional analytical and numerical model systems, showing that its origin is rooted in the frequency changing between the ground and the excited states in multidimensional systems.
A 2D analytical model, in particular, revealed that the δ shift can be approximated by
where ωg and ωe are the ground- and excited-state frequencies of the vibrational modes, respectively.

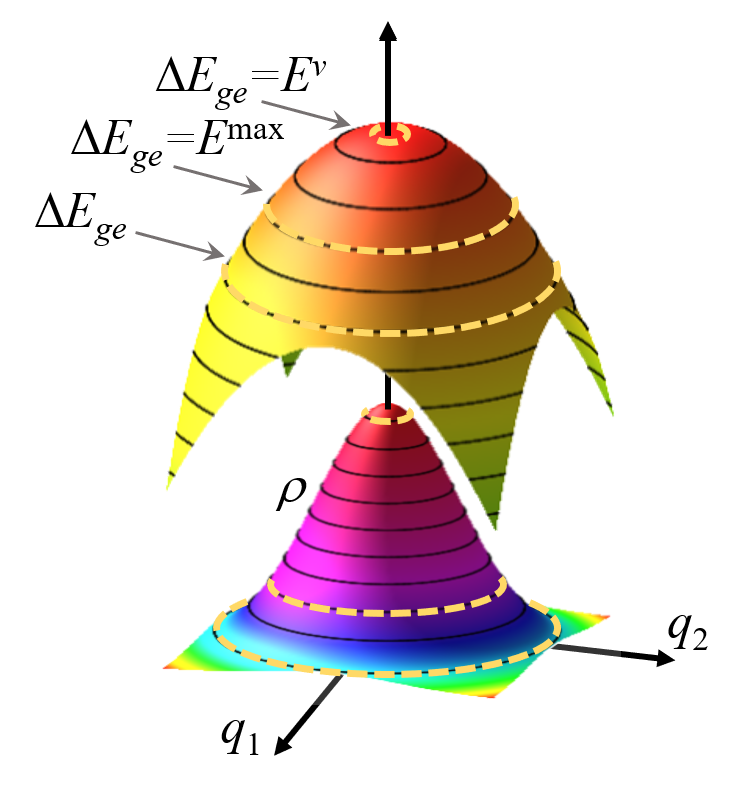
With this simple model, it is easy to understand the origin of the δ shift. For some specific photon energy, the spectral intensity is determined by both the ground-state population on the isoenergetic line satisfying the resonance condition and the length of this line. In one limiting case, the ground state population is maximal, but the line length is too short, yielding a low spectral intensity. In the other limiting case, the curve length tends to infinite, but the ground state population is null, also yielding a minimal intensity. Between the two extremes, the band maximum occurs at a point shifted from the vertical excitation by δ.
Going beyond the analytical model, we computed a benchmark of ab initio results for the δ shift based on a comparison of vertical excitations and band maxima calculated with the nuclear ensemble approach for 60 transitions in the 28 organic molecules in the Mülheim molecular dataset.
- The mean value of the δ shift is 0.11 ± 0.08 eV.
- The mean value of the band width is 0.32 ± 0.14 eV.
Based on these results, we recommend that the δ shift should be systematically taken into consideration in the comparison between the experimental band maximum and computed vertical excitations.
For instance, if you computed a CASPT2 vertical excitation at 5 eV, you should shift this value by 0.1 eV and compare 4.9 eV to band experimental band maximum.
As a bonus of this work, we wrote a simple code to generate spectrum convolutions out of a list of vertical excitation energies and oscillator strengths:
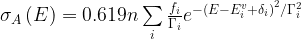
In this code, we can individually control the δ shift and the width Γ of each band. Moreover, the code takes the oscillator strength as the band area and delivers the simulated spectrum in absolute units of absorption crosssection (Å2.molecule-1) or extinction coefficient (M-1.cm-1).
This paper has been published in the special issue of the XX SBQT 2019, which I had the honor of delivering the opening lecture.
MB
Reference
[1] S. Bai, R. Mansour, L. Stojanović, J. M. Toldo, and M. Barbatti, On the Origin of the Shift Between Vertical Excitation and Band Maximum in Molecular Photoabsorption, J. Mol. Model. 26, 107 (2020) DOI:10.1007/s00894-020-04355-y (open source)